Welcome to My Portfolio
Below are some of the web map and apps I have created using JavaScript, HTML, and CSS with Bootstrap, Leaflet, GeoServer, CS, and D3. Feel free to click on the "View" button in the album below to view the desired interactive web map/app. Cheers!
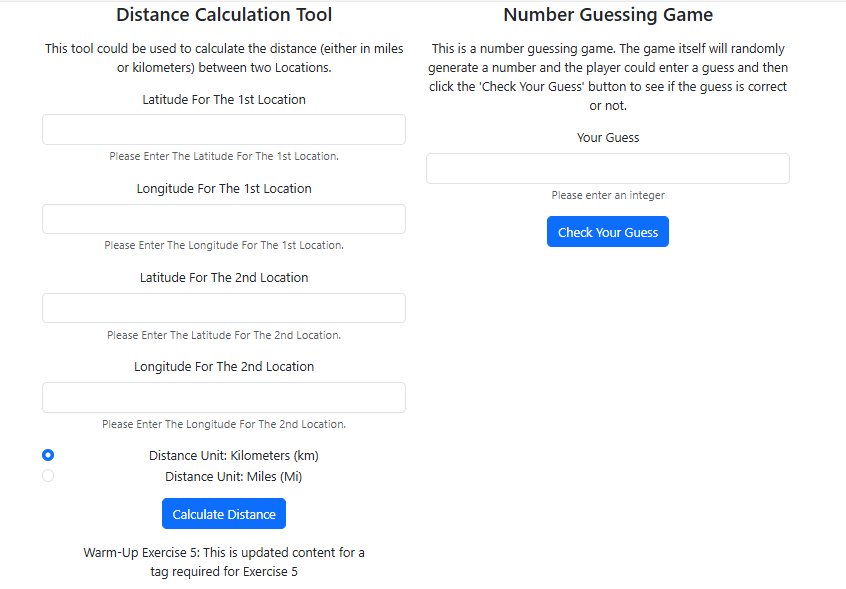
Unit 1:
This is a simple web app containing a distance
calulation's
tool
and number guessing game that I created using Javascript, HTML, CSS, and Bootstrap.
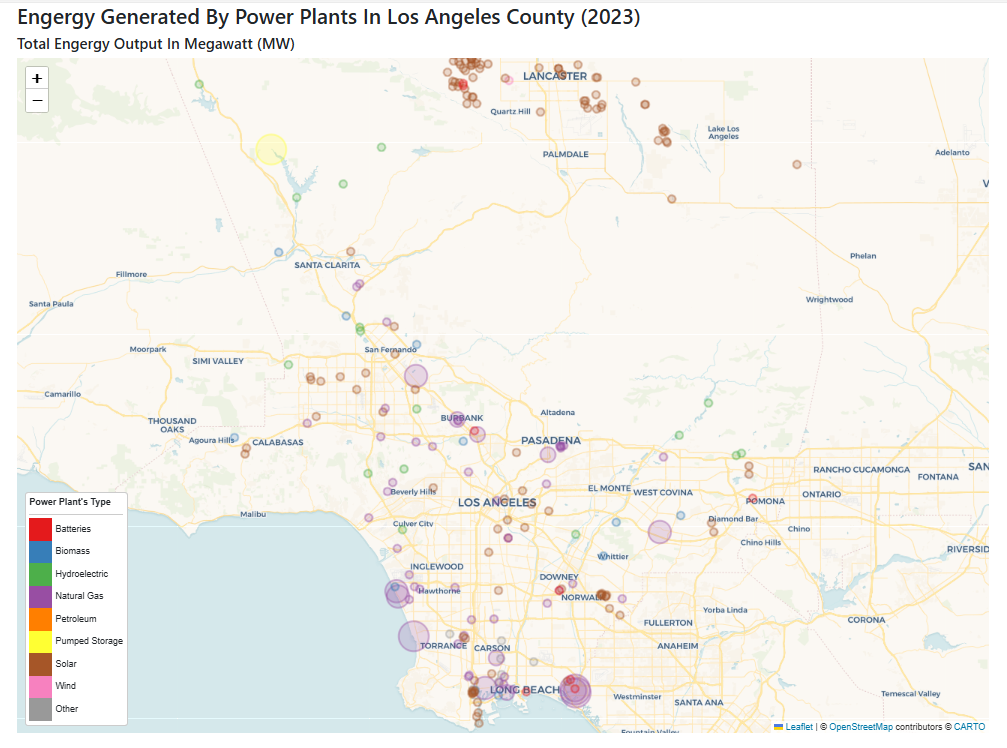
Unit 2 (Part 1):
This is a thematic map showcasing the total
energy
output generated
by power plants in Los Angeles County in 2023. I created this web map using
JavaScript, HTML, CSS and Leaflet with data from the U.S. Energy Information
Administration (EIA).
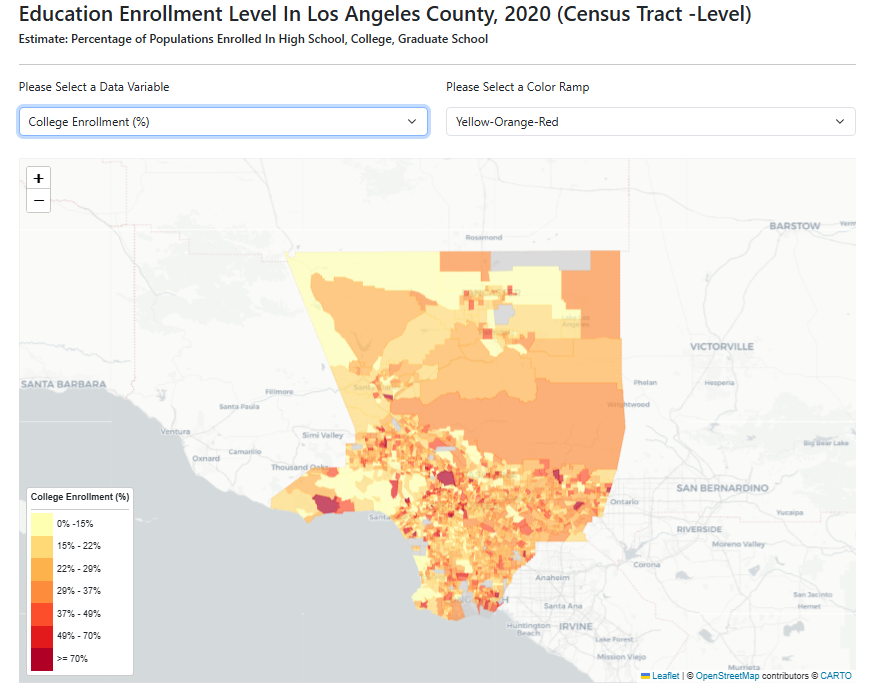
Unit 2 (Part 2):
This is a choropleth map displaying the 2020
education enrollment
level in Los Angeles County that I created using JavaScript, HTML, CSS, Boostrap,
and Leaflet with the ACS census-tract level's data from the U.S. Census Bureau.
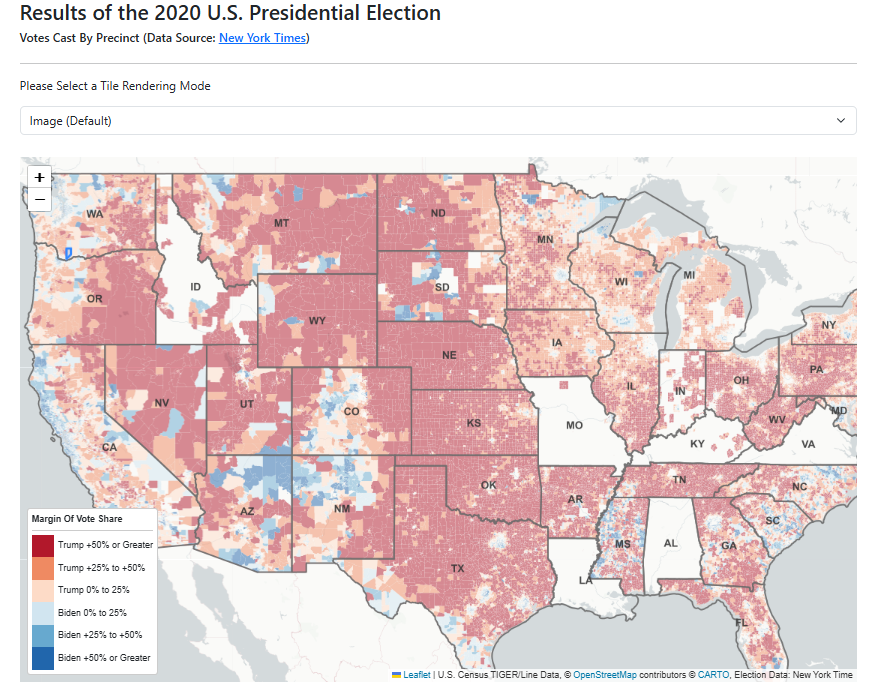
Unit 3:
This is a choropleth map exhibiting the 2020 U.S.
Presidential
Election's result that I created using JavaScript, HTML, CSS, WFS and WMS layers
configured using GeoServer. The data comes from the New York Time.
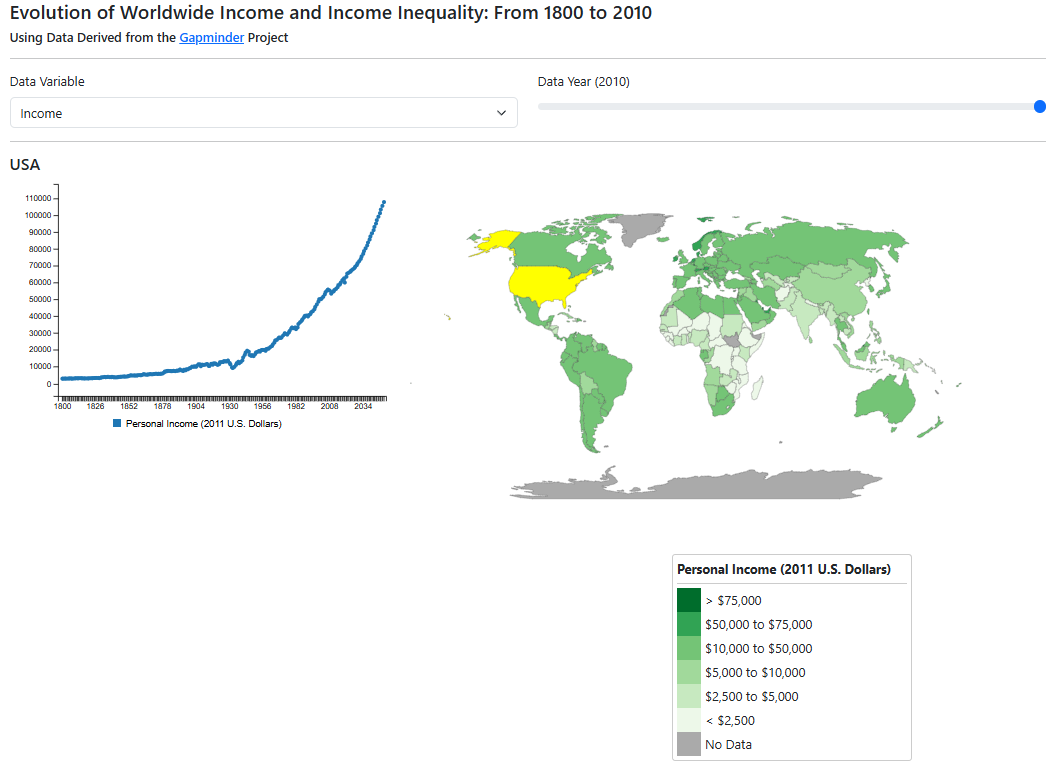
Unit 4:
This is a choropleth map with a time-series chart
showcasing the
evolution of worldwide income and income equality from 1800 to 2010 that I created
using JavaScript, HTML, CSS, C3, and D3. The data used here is derived from the
Gapminder Project.
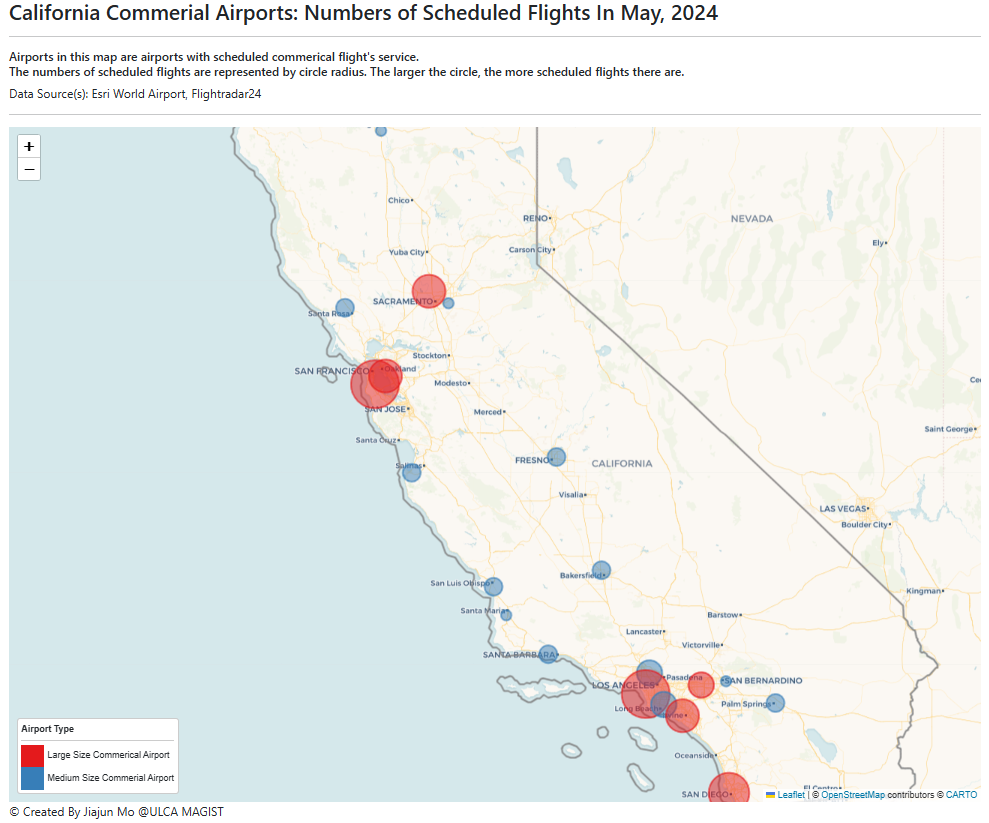
Unit 5:
This a thematic map showcasing the numbers of scheduled
flights in California's commerical airports in May, 2024. I created this map using
JavaScript, HTML, CSS, Boostrap, and Leaflet with data from Esri and
Flightradar24.com.